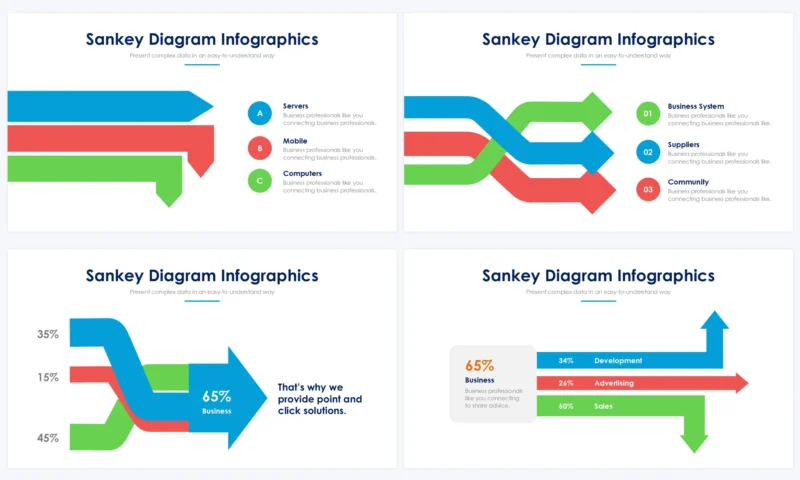
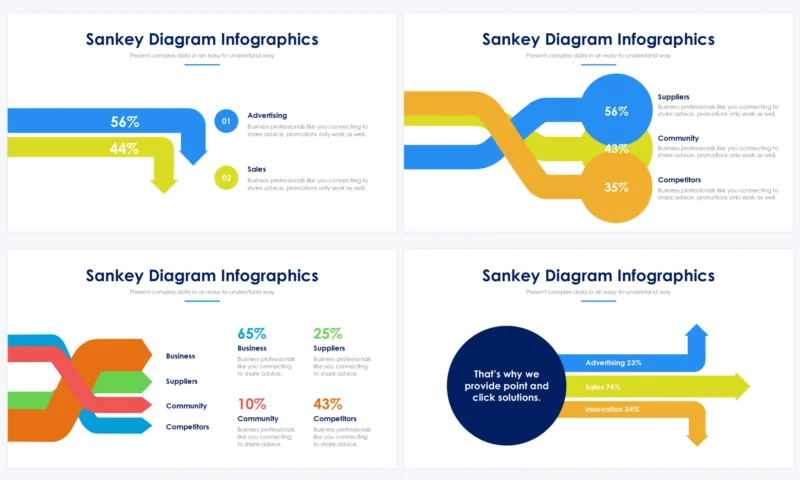
Sankey Diagram Slides
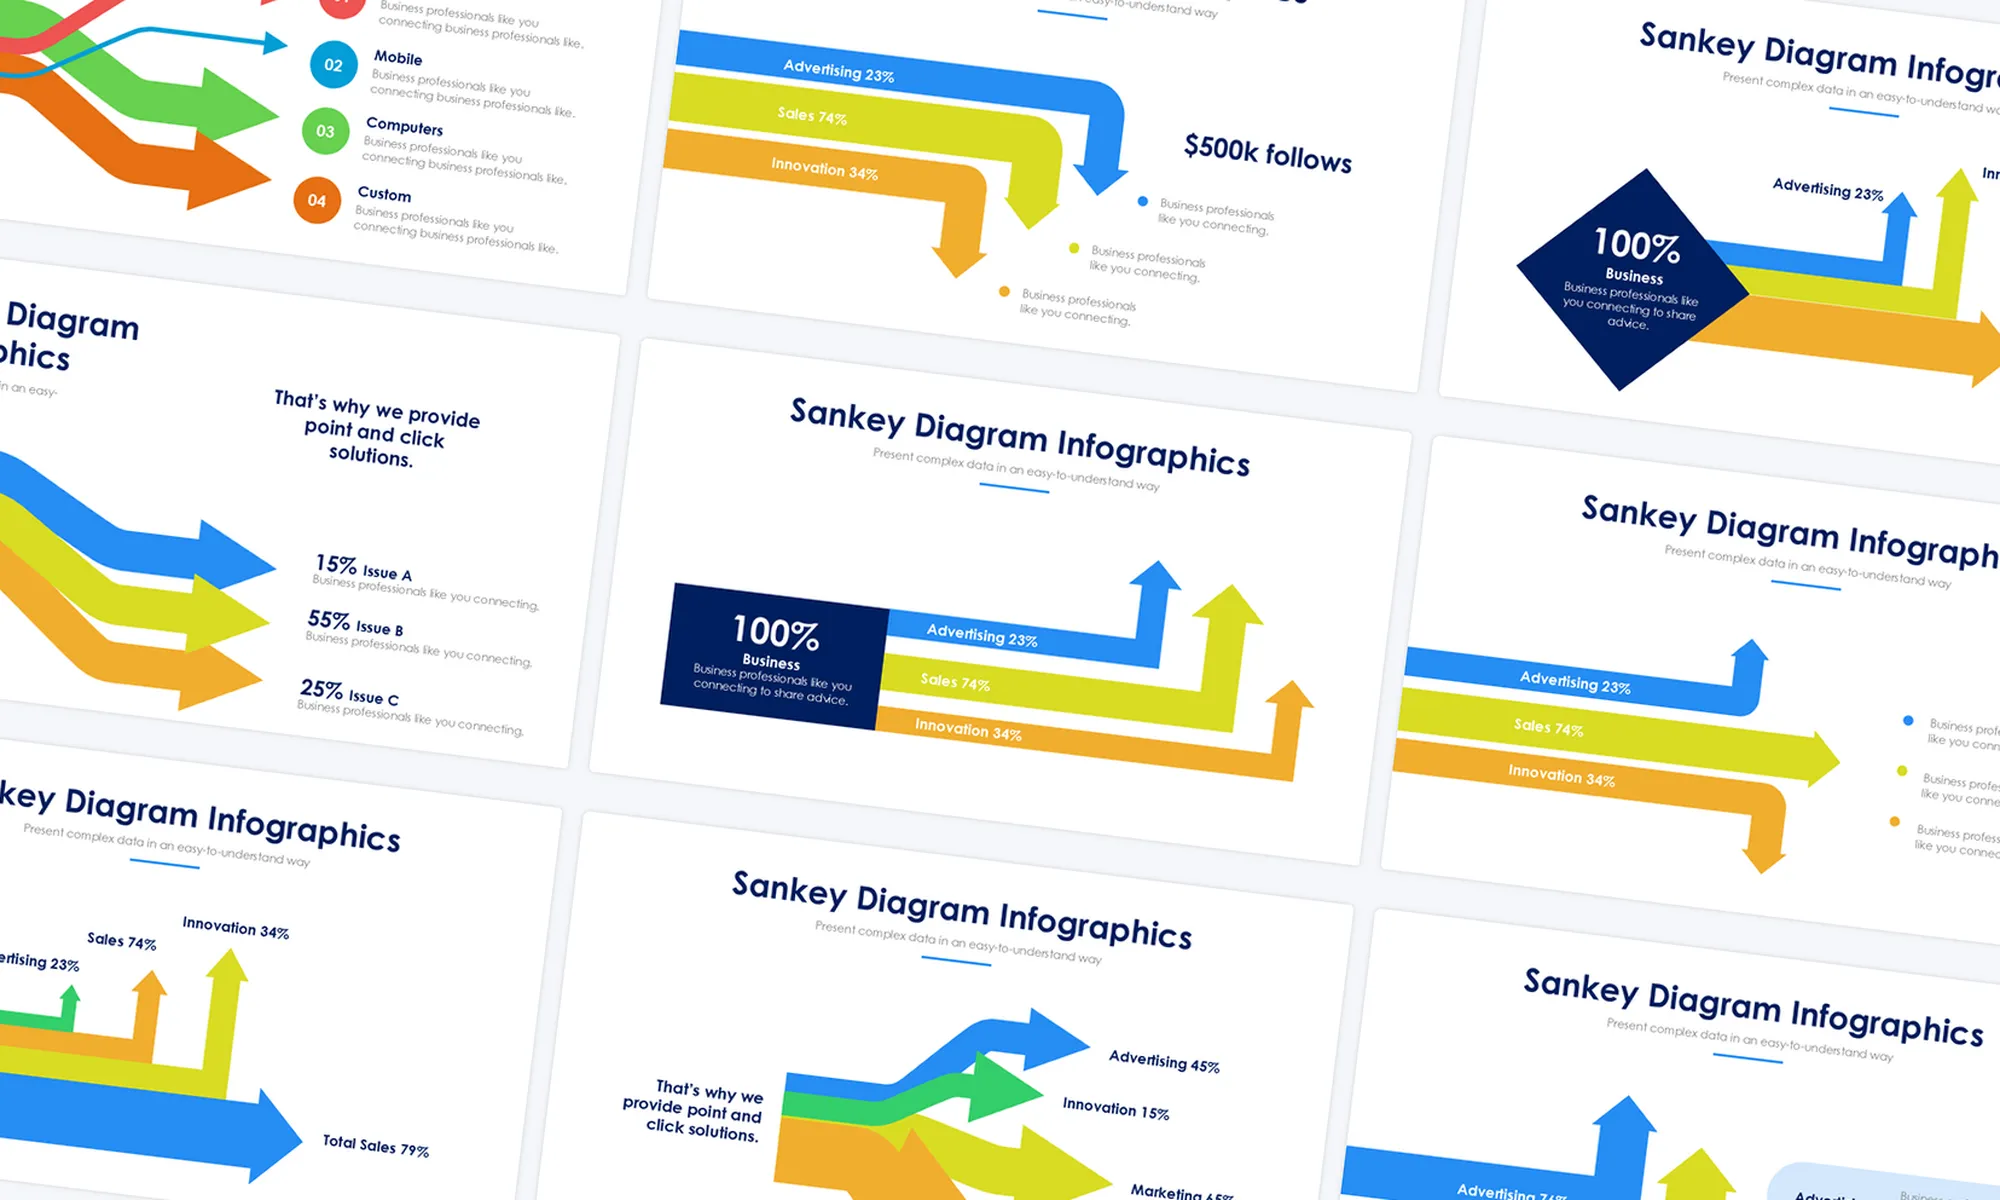
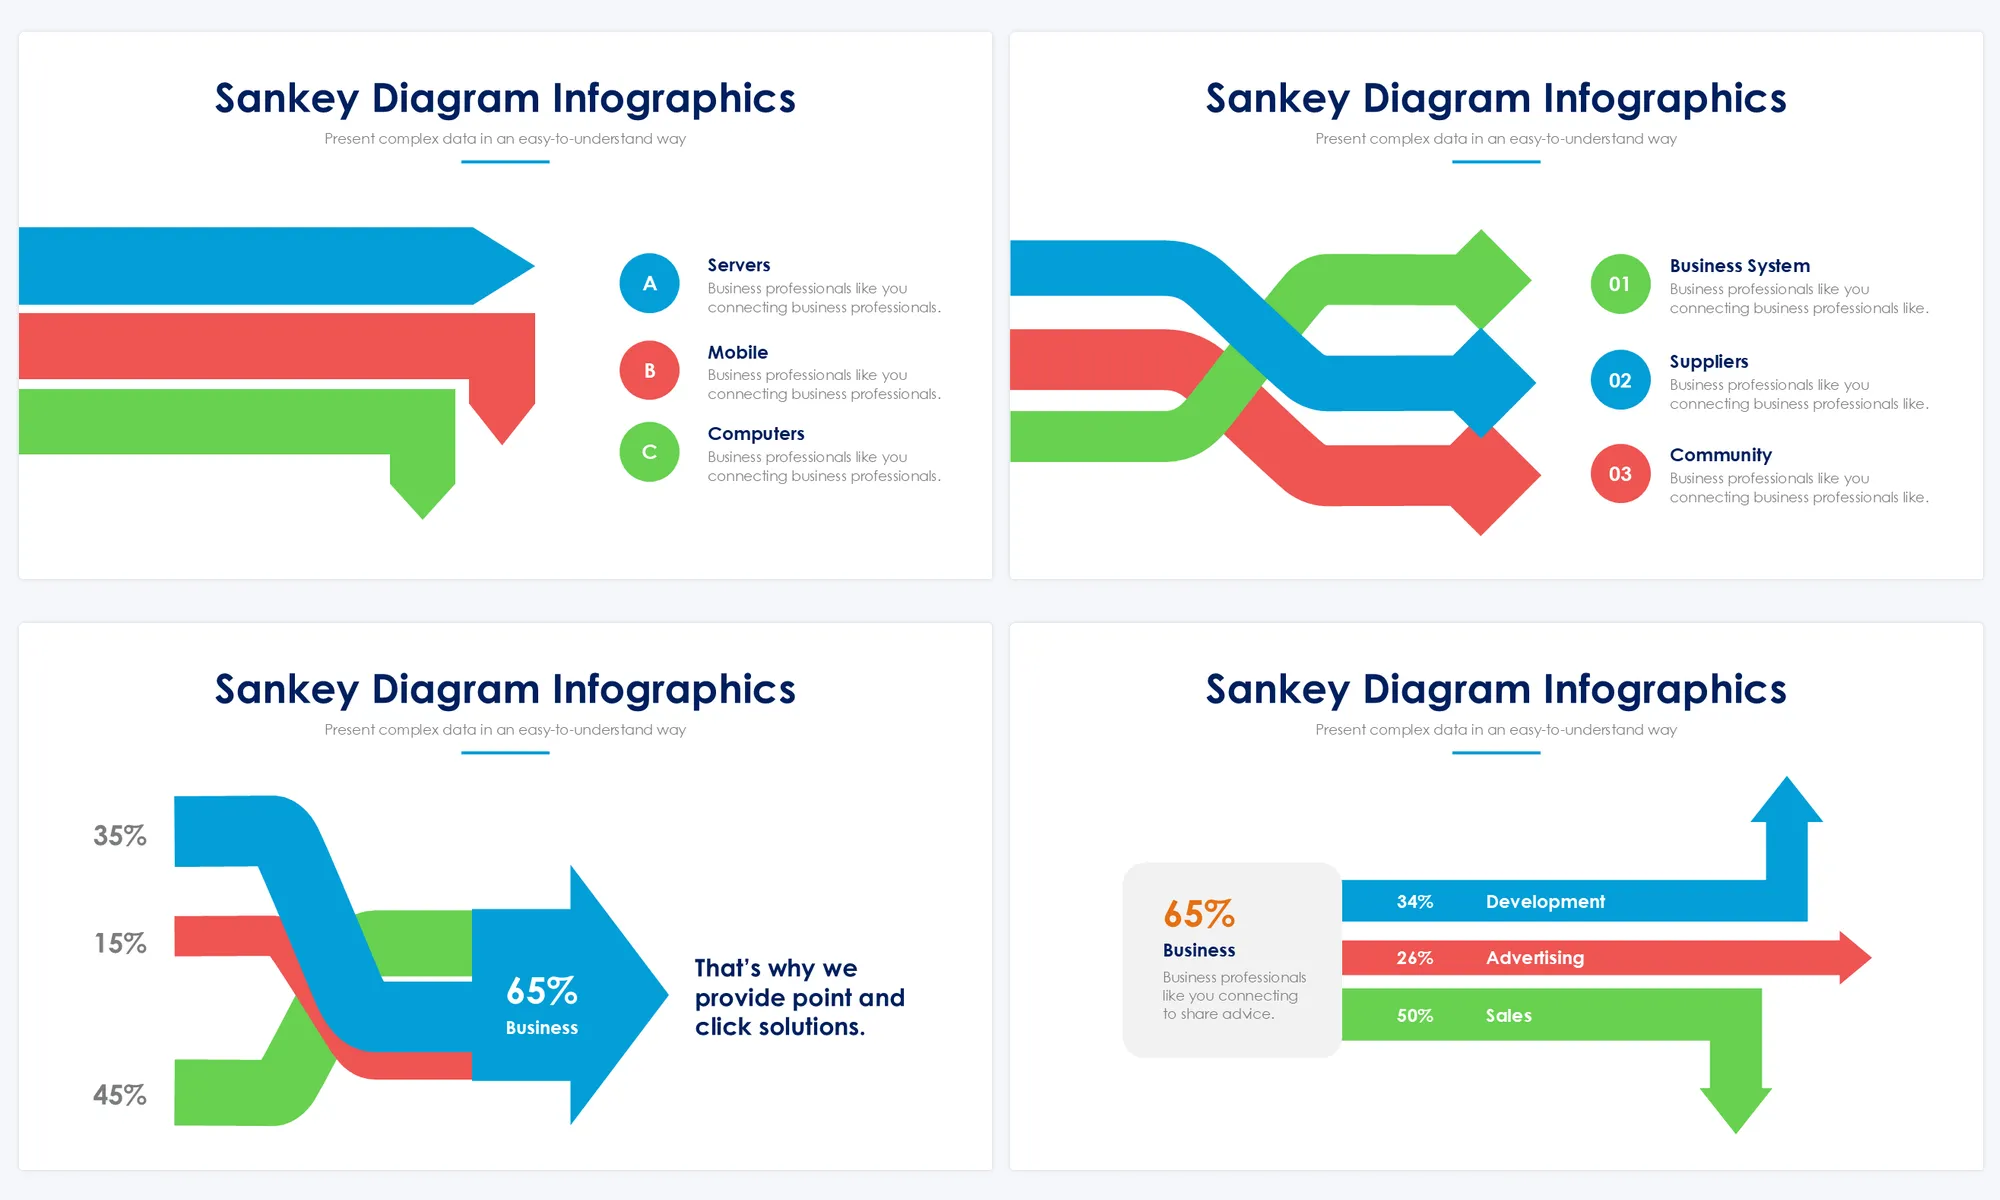
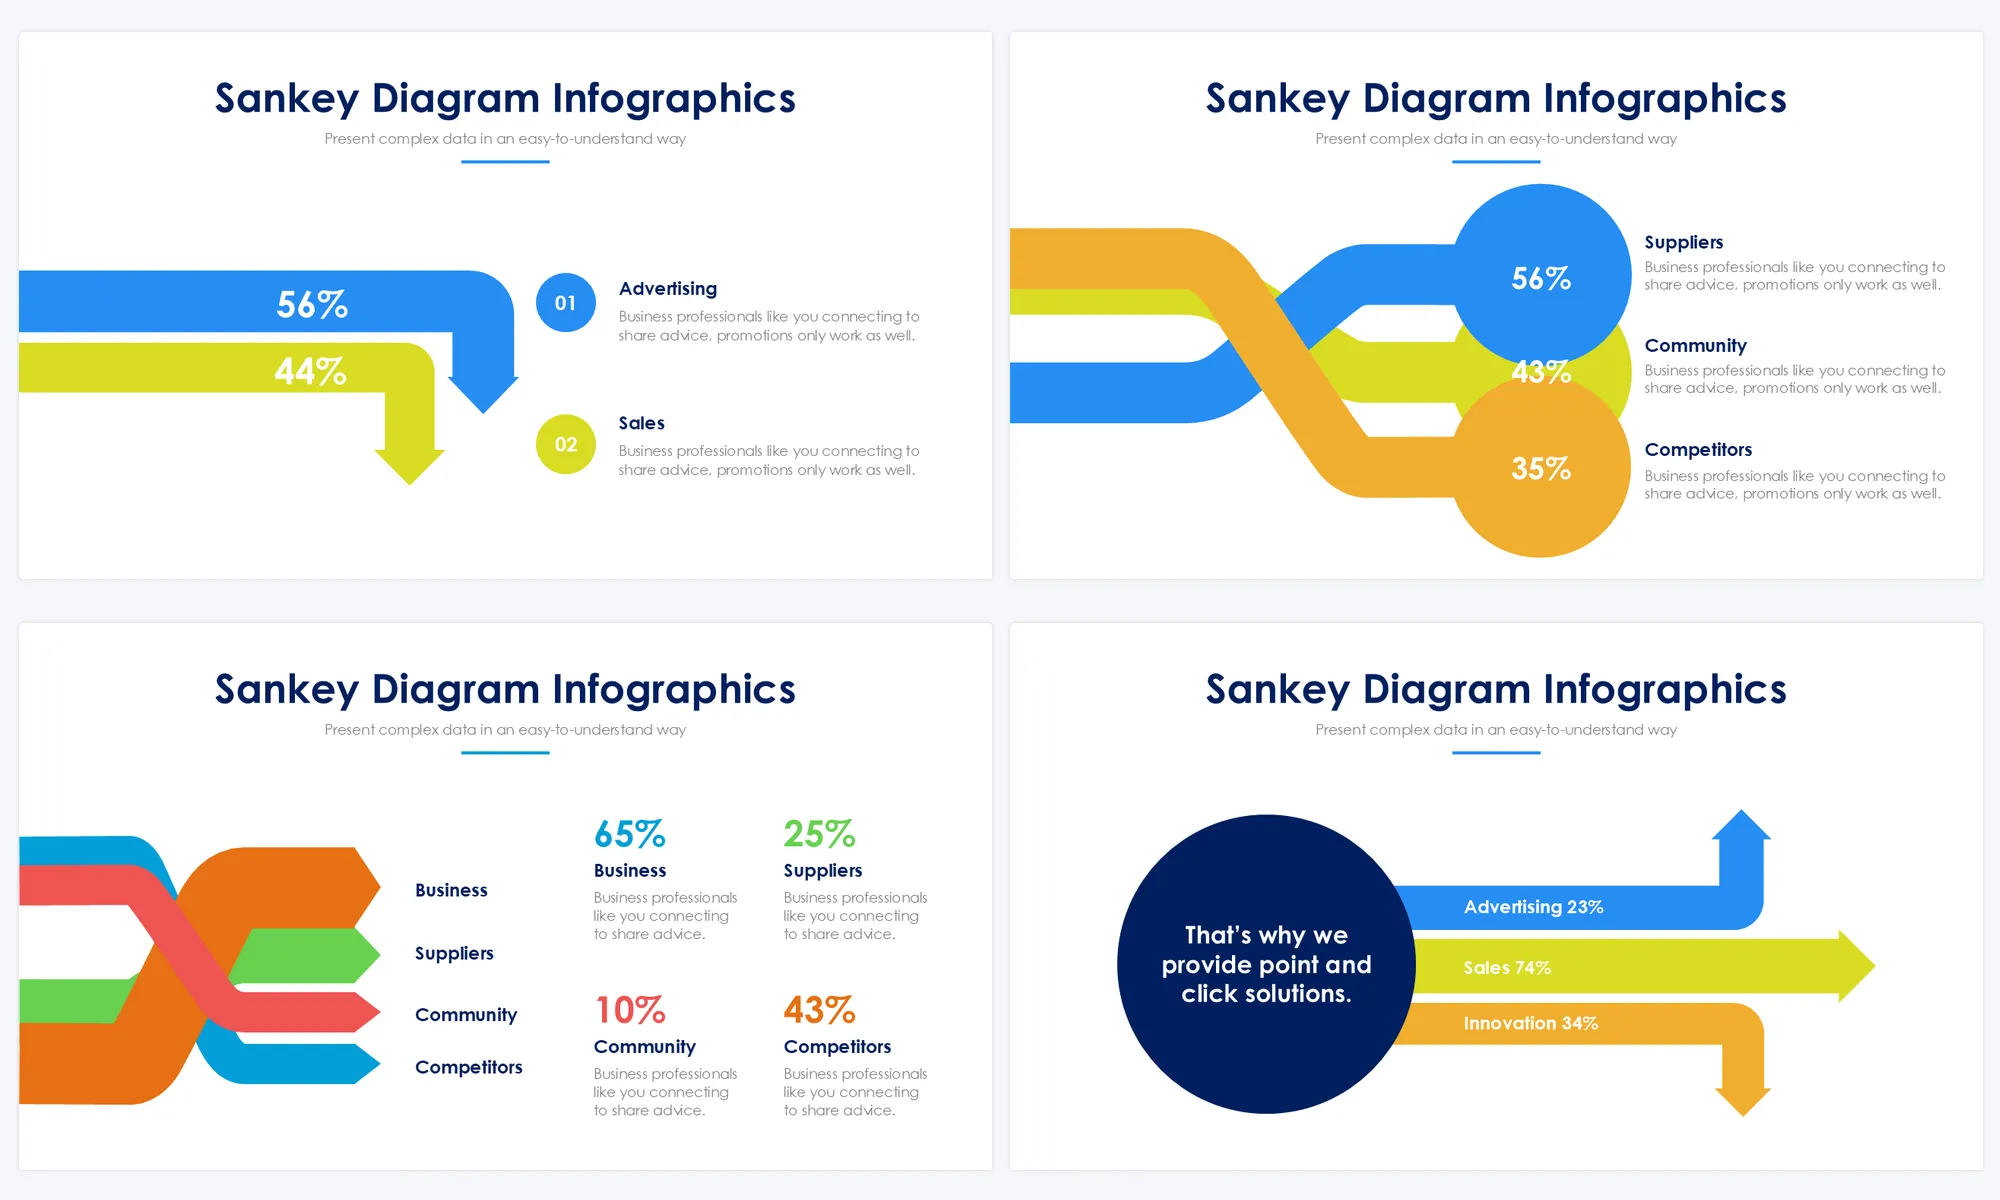
Visualize flow and distribution patterns of energy, resources, or data with Sankey Diagram Slides. Present Sankey diagrams depicting flows, connections, or proportions in a system, illustrating energy transfers, material flows, or resource allocations using visuals and explanatory content. These slides aid in presenting complex data relationships.
Slides Templates Overview:
- PowerPoint Files
- Apple Keynote Files
- Google Slides Files
- 16:9 HD Aspect Ratio
- All graphics are resizable and editable
Unlock this Template
This product is also included in the Full-Access Pass + FREE Lifetime Updates
Are you already Premium? sign in to access.
Works with :
Buy today and you will get:
- Full Access to our entire site
- 9500+ Unique Slides and Infographics
- 260+ Categories
- Free! Lifetime Updates


